Setting the Right Metrics for Customer Experience Improvement
/
The Customer Experience Metrics: How to Win Over Your CFO article provided insights into how to align with the goals of the CFO to accelerate your organization's customer experience improvement programs. However, as covered in Customer Experience For Dummies, you’ll need more to sway your CFO; you need hard facts about customer behavior and the impact experience has on loyalty to your brand.
The three key customer experience metrics recommended in Customer Experience For Dummies are:
- Likelihood to Recommend: Measures how likely a customer is to recommend your company to friends or colleagues. Customers who respond with a high rating are among your most loyal. Not only do they provide you with free advertising when they recommend your company to others, but they're also less likely to share negative feedback about you on your website or on social media.
- Likelihood to Switch to a Competitor: Reveals how likely a customer is to take her business elsewhere. These days, customers can switch to a competitor with the click of a mouse. That makes your efforts to retain the customers you have even more important! It only takes one bad experience to drive a customer away...particularly if a competitor responds by providing that customer with an excellent customer experience.
- Likelihood to Repurchase: This reveals how likely a customer is to purchase from you again. If a customer has a good experience with your company, that customer will be much more willing to buy from you again!
These metrics can offer a great starting point of how your customers feel about their experiences and give some insight into likely future behaviors. However, to more fully grasp the total customer experience spectrum as viewed through the eyes of your CFO, you’ll probably need to get more specific in the data you capture.
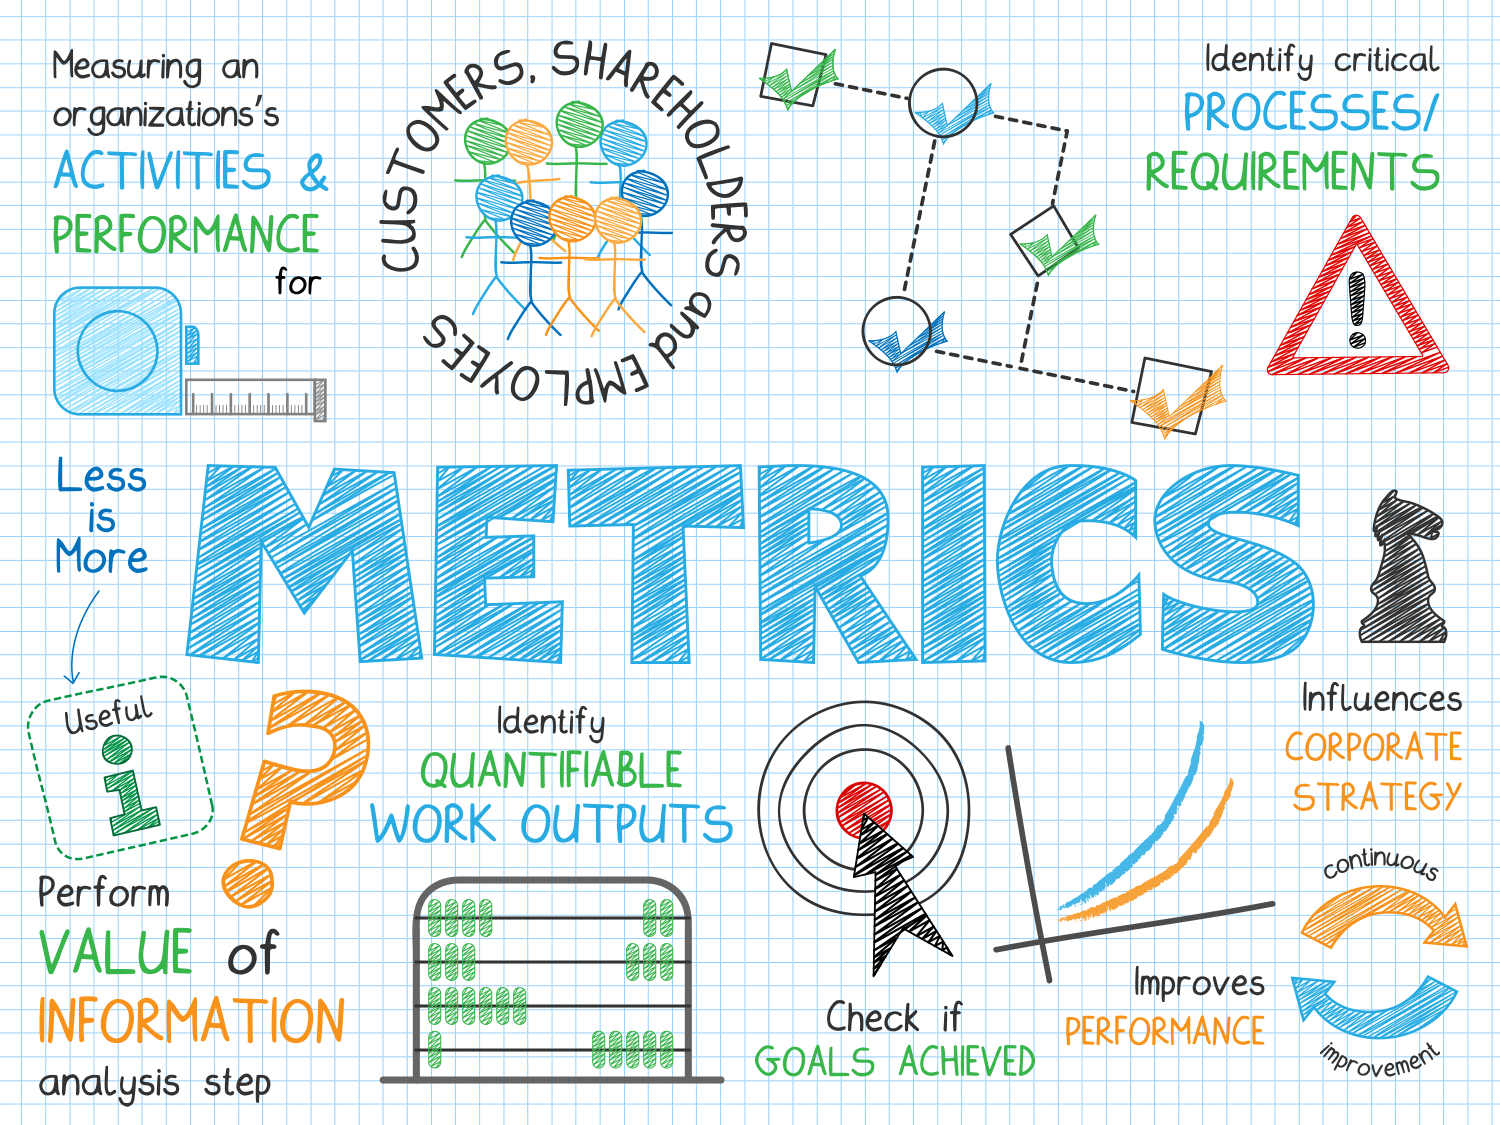
Pursue Your Metrics Thoughtfully
Even with the best intentions, it’s easy to slip into overload mode when thinking about all the data you could capture. Don't let quantity masquerade for quality. Using a statistical approach/tool called "correlation analysis" will help you understand connections between different metrics and specific customer behaviors. This will then enable you to plan better targeted, more effective actions. Remember, selecting the right metrics to draw these connections is an iterative process. It may take some trial and error to settle on the right measurements specific to your specific strategic goals.
When you more fully understand your entire customer's journey, you can begin to see which touch points have the greatest impact on overall engagement and satisfaction scores. This provides insight into specific key drivers in your organization’s processes that can be improved.
- Some typical pairs of metrics to look at might include:
- Price sensitivity and overall satisfaction
- Desired customer behaviors and overall engagement
- % of your portfolio of services used and likelihood to recommend
Obviously, there are thousands of potential points of measurement that you can create for your customer experience research, but remember that having too many metrics can not only dilute your focus.
Being deliberate about finding data correlations that link with your customer's journey will achieve faster results. Using this type of metrics approach might help substantiate the desired customer experience program investments you want to present to the C-suite.